상품상세정보
nComputer controlled data acquisition and analysis.
nFast capacitance meter
nConversion time less than 50 microseconds, low noise.
nAnalog output.
nNote that the Boonton 7200 has been replaced by Semetrol capacitance meter.
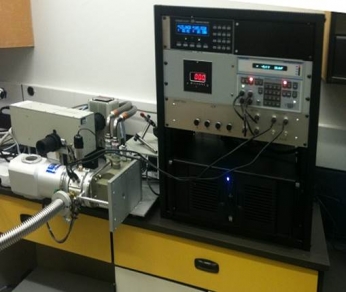
nCryostat
nTop figures show previous configuration. Bottom is the present configuration low vibrationcryochamber.
nSample stage with temperature sensor close to sample position
nContact with probes or connections for packaged devices
nHeaters, temperature sensor, fast stabilization, e.g. <1 min. for temperature increase of 5K.
nTemperature controller – GPIB control
nVacuum pump
n<10 mTorr
nVacuum gauge on cryostat – avoids unnecessarily excessive pump down time.
nPreparation:
nCheck I-V curve for suitable voltage range.
nCheck the C-V profile. Determine appropriate voltage range, e.g. where depletion region is near zero, where features such as a heterojunction appear. Ensure that the built-in potential is reasonable for diodes – no excessive unintentional surface insulating layer. A capacitance calculator utility program is provided to assist in checking that the measured capacitance is in accordance with expectations from device properties. Measure carrier concentration – used in deep level concentration calculations.
nData acquisition:
nTest various experimental conditions to optimize the transient response, or to select conditions that result in optimum response from a particular trap of interest, e.g. avoiding surface states, or limiting response from a trap with small capture cross section that is overlapping another trap of interest.
nAcquire the data. Ensure that the temperature is stable during averaging of each transient. Average transients for improved signal. Survey scans may also be recorded as fast as the cryostat can cool or heat.
nData Analysis:
nPlot the rate window spectrum. Determine how many traps are present, determine if any are broad or shouldered, indicating more than one component.
nRate window analysis: sampling points t1 and t2 are automatically generated to obtain a wide range of emission rate windows. Peak positions are automatically determined and the points plotted on the Arrhenius plot.
nFit the transients for offset, emission rate and amplitude. This can be done over the full transient or over selected regions of the transients. Selected regions can be used to extract better fits, if the transient is long enough to include more than two components. Longer data acquisition period allows longer, more accurate Arrhenius lines. View the Arrhenius data and select points for calculation of trap energy and capture cross section.
nSimulation – measured or reported trap characteristics can be used to generate a full transient data set for processing and comparison.
nCompare to published data – convenient plot of published trap energies versus cross sections allows fast comparison to published signatures. Expandable user library.
Several spectra from deep level defects in GaN with the emission rates,
or rate windows, listed in the upper right.

Energy and capture cross section are determined from an Arrhenius plot of T2/e versus 1/kT.
The Arrhenius points are generated automatically.

 HOME > 회사소개 >분석장비